Showing posts with label statistics. Show all posts
Showing posts with label statistics. Show all posts
Nov 1, 2010
Interactive Map
New York Times interactive immigration map.
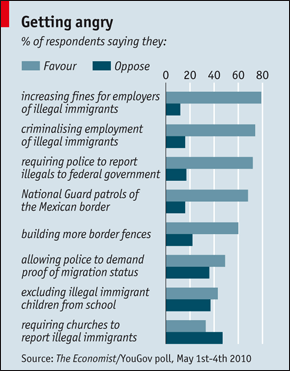
What America Believes

*Our View: Americans who get their news from more balanced sources, tend to lean towards a more moderate solution to America's immigration problem. Those who watch and read more bloated news, like Immigration Counters that have no real evidence behind their statistics, lean to more extreme approaches.
Period of Entry of the Unauthorized Immigrant Population
Period of Entry of the Unauthorized Immigrant Population:
January 2009
Estimated population
January 2009
Period of entry Number Percent
All years . . . . . . . . . . . . . . . . . . . . . . . 10,750,000 100
2005-2008 . . . . . . . . . . . . . . . . . . . . . . 910,000 8
2000-2004 . . . . . . . . . . . . . . . . . . . . . . 3,040,000 28
1995-1999 . . . . . . . . . . . . . . . . . . . . . . 3,080,000 29
1990-1994 . . . . . . . . . . . . . . . . . . . . . . 1,670,000 16
1985-1989 . . . . . . . . . . . . . . . . . . . . . . 1,190,000 11
1980-1984 . . . . . . . . . . . . . . . . . . . . . . 860,000 8
http://www.dhs.gov/xlibrary/assets/statistics/publications/ois_ill_pe_2009.pdf
*Our take: Note the significant drop since the early 1990s. This can be attributed to a stronger border patrol and stricter laws. This also contradicts the belief of many American people that more undocumented workers are crossing into our country without legal status.
January 2009
Estimated population
January 2009
Period of entry Number Percent
All years . . . . . . . . . . . . . . . . . . . . . . . 10,750,000 100
2005-2008 . . . . . . . . . . . . . . . . . . . . . . 910,000 8
2000-2004 . . . . . . . . . . . . . . . . . . . . . . 3,040,000 28
1995-1999 . . . . . . . . . . . . . . . . . . . . . . 3,080,000 29
1990-1994 . . . . . . . . . . . . . . . . . . . . . . 1,670,000 16
1985-1989 . . . . . . . . . . . . . . . . . . . . . . 1,190,000 11
1980-1984 . . . . . . . . . . . . . . . . . . . . . . 860,000 8
http://www.dhs.gov/xlibrary/assets/statistics/publications/ois_ill_pe_2009.pdf
*Our take: Note the significant drop since the early 1990s. This can be attributed to a stronger border patrol and stricter laws. This also contradicts the belief of many American people that more undocumented workers are crossing into our country without legal status.
Subscribe to:
Posts (Atom)

